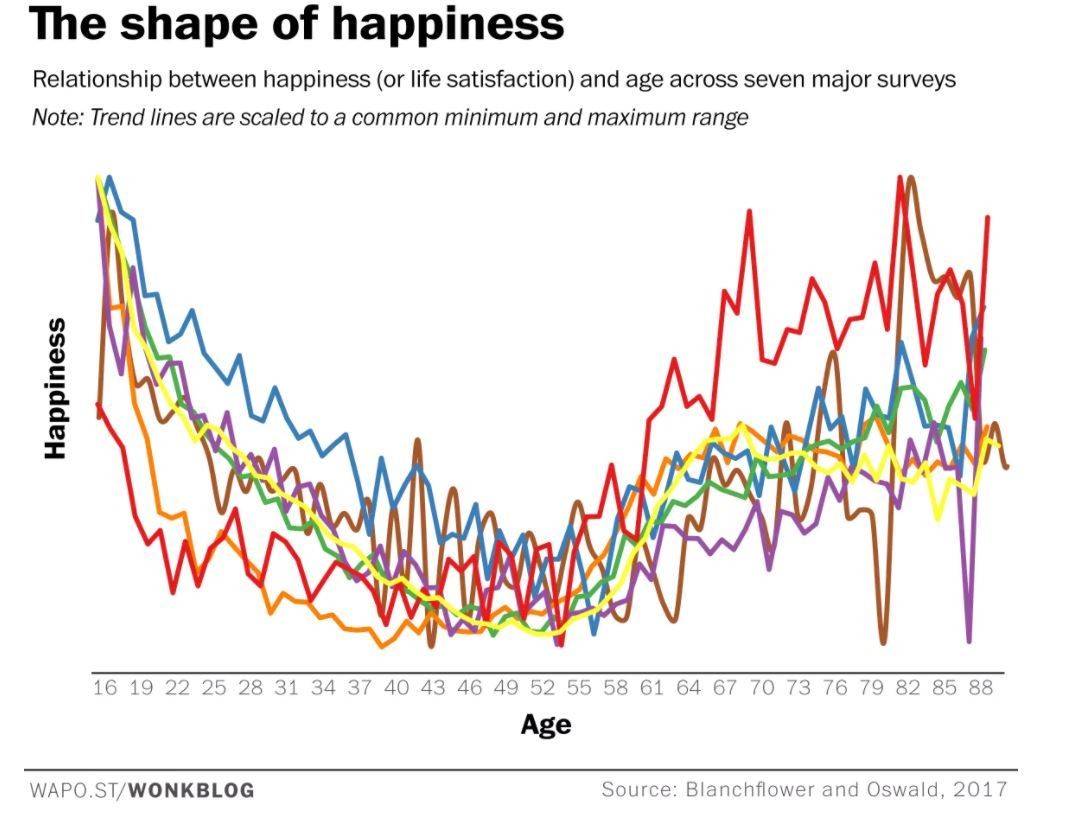
“Life gets better” is what many younger to Middle Ages adults tell others that are younger than them. This graph would say otherwise! According to research done that questioned various people about how happy they were by age, life seems to get worse, then better. People repeatedly said they were more and more depressed from 20-40 years old. It appears most people felt very dissatisfied with their lives from 40-60. Then, from 60-80 years old, people felt more satisfaction.
Many reasons could be behind this finding such as heavy work schedules (being a “wageslave”) and the age most people have kids. Heavy work loads, more expenses for children, and less time to be around the children could make anyone feel depressed and dissatisfied with life.
To anyone who feels the same, we can see from this chart that is does in fact get better, but not after it gets worse !
Related posts:
A torrent is a file sent via the BitTorrent protocol. It can be just about any type of file, such as a movie, song, game, or application. During the transmission, the file is incomplete and therefore is referred to as a torrent. Torrent downloads that have been paused or stopped cannot be opened as regular files, since they do not contain all the necessary data. However, they can often be resumed ...
Many investors try to time the market for the highest return. Timing the market does not work, as shown in the infographic below. It would also be equally as disadvantageous to try and time a recession for maximum return. For an investor that invest in the S&P 500 in 1995, the average annual return yielded $65,000 for each $10,000 invested if the inverstor held until 2015. The informat...
The Kelly Global workforce index survey 2009 highlights the importance of continued training and skill development.Compared to the global average, lesser indian employees feel that the level of training provided by their employers is inadequate.Older employees are more concerned about the current quality of training than their younger counterparts.
This avant-garde Range Rover has capability at its core. It leads the way in progressive design from the renowned Range Rover floating roof to the refined interior with Suedecloth or Windsor leather options. Read more about the features of this avant-garde Range Rover below.
 Upload your infographic here and contribute to our community.
Leave a Reply