Talks of a recession in the United States economy has been discussed by many over the years as this cycle has been the longest bull market in history without having a recession. The economy has been booming since the last economic recession during 2009.
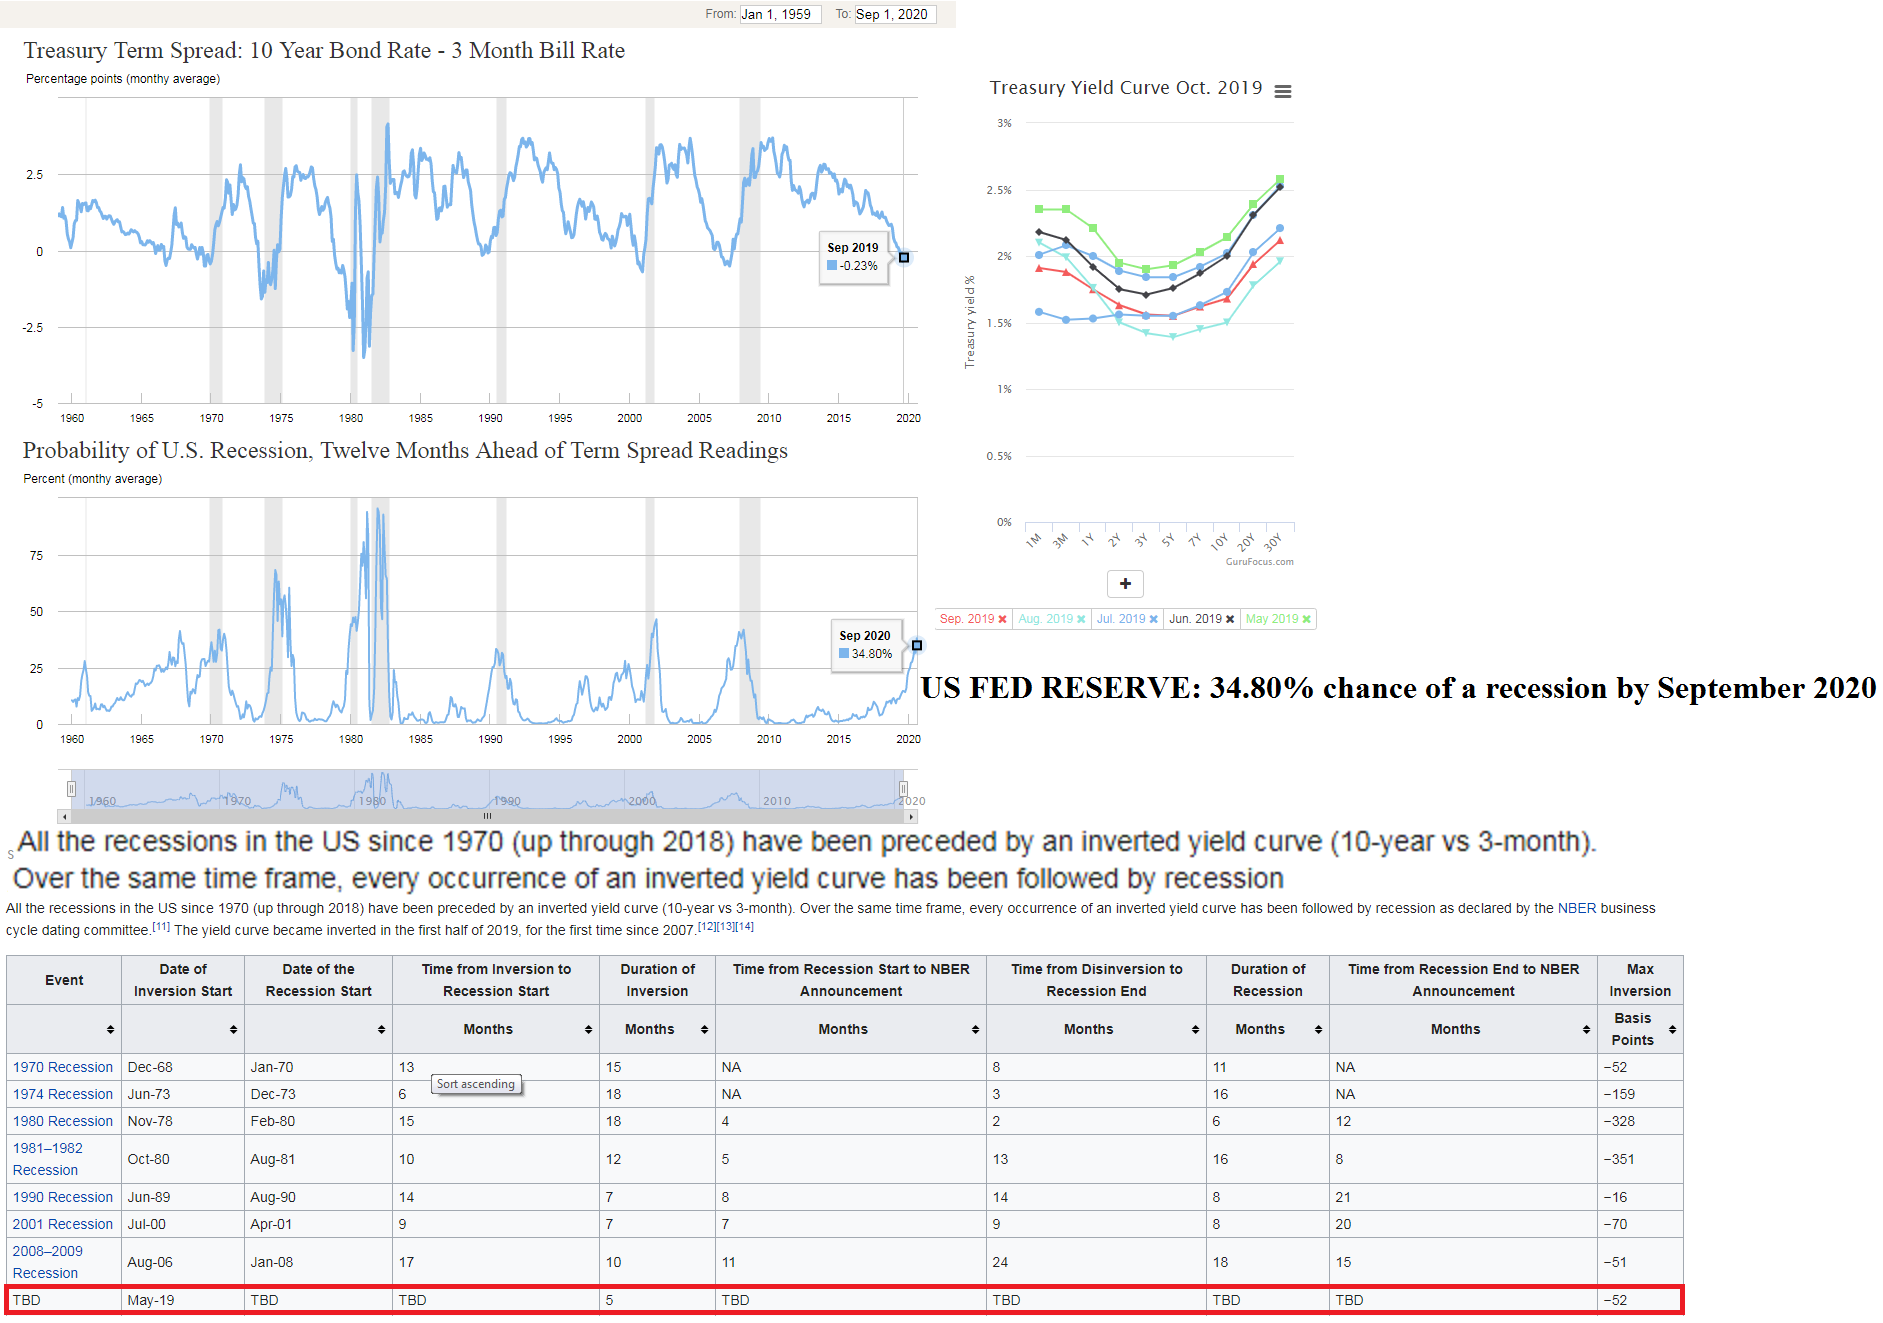
The below graphic will show the reader that the economy has always fell into recession when the 3 month treasury rate yields more than the 10 year treasury rate. This is displayed historically with recessions shaded in gray.
The federal reserve now has a recession probability of 35% happening by September 2020.
Related posts:
Seasonal Worker Chart
Each year businesses prepare for the holiday onslaught by calling in the reserves: seasonal employees. These temporarily hired hands help companies get through the busy season without having to keep extra staff year-round. But finding the right employees takes considerable effort and training. We examine the world of seasonal employment: what other companies are doing and how you can successfully ...
Each year businesses prepare for the holiday onslaught by calling in the reserves: seasonal employees. These temporarily hired hands help companies get through the busy season without having to keep extra staff year-round. But finding the right employees takes considerable effort and training. We examine the world of seasonal employment: what other companies are doing and how you can successfully ...
Average US Consumer Spending
Everything You Need To Know About Wearing Regalia
Find out everything you need to know about wearing Regalia, what it’s meant for, what makes it so special, and the common types of Regalia. As a long established tradition throughout the world, Regalia is more than just an accessory, it expresses some degree of exclusivity that members of an organization are proud to be a part of.
Find out everything you need to know about wearing Regalia, what it’s meant for, what makes it so special, and the common types of Regalia. As a long established tradition throughout the world, Regalia is more than just an accessory, it expresses some degree of exclusivity that members of an organization are proud to be a part of.
US Renters Insurance
Part one is the most expensive places in the US to rent. Source: Census.gov. California has only the average rent of $1, 135, Connecticut has only the average rent of $970, Florida with $947, Haiwaii with $1,362, Massachesets is $947 and maryland average rent is $1,074
Part one is the most expensive places in the US to rent. Source: Census.gov. California has only the average rent of $1, 135, Connecticut has only the average rent of $970, Florida with $947, Haiwaii with $1,362, Massachesets is $947 and maryland average rent is $1,074
Consumer Comparison -- Where People Shop for Mortgages
USA and China Trade Relationship
China and USA Trade relationship across the globe are getting stronger than we expected.From Us, there are $337.8 billion. That includes in their top 5. Apparel and footwear, computer and parts, toys and bicycles, televions and furnitures. While in china its only $71.4 billion and includes in it are soybeans, semiconductors, civilian aircraft, plastic materials and copper.You can also see here how...
China and USA Trade relationship across the globe are getting stronger than we expected.From Us, there are $337.8 billion. That includes in their top 5. Apparel and footwear, computer and parts, toys and bicycles, televions and furnitures. While in china its only $71.4 billion and includes in it are soybeans, semiconductors, civilian aircraft, plastic materials and copper.You can also see here how...
CG: Economics, Evironment, Infastructure, Politics, and Society
America and Poverty
National Debt Simplified
There are two kinds of debt that affects globally.Public debt is an acumulative total of debt owed by all levels of government and includes both interally, externally and public and privte debts. External debt is a total debt owed to lenders located outside of a country.
There are two kinds of debt that affects globally.Public debt is an acumulative total of debt owed by all levels of government and includes both interally, externally and public and privte debts. External debt is a total debt owed to lenders located outside of a country.
UK vs World Economies
We live in a world thats shrinking due to communication and technology, yet growing in terms of overall wealth and prosperity. In this graphic, we take a look at a few of the worlds leading nations, in terms of economic conditions for individuals and nations. From the perspective of the UK, one of the oldest economies in the world.The UK treasury just released ist spending review which specifies t...
We live in a world thats shrinking due to communication and technology, yet growing in terms of overall wealth and prosperity. In this graphic, we take a look at a few of the worlds leading nations, in terms of economic conditions for individuals and nations. From the perspective of the UK, one of the oldest economies in the world.The UK treasury just released ist spending review which specifies t...
How to Start Cutting Costs
Pharmaceutical Drug Sales Chart
Pharmaceutical companies spend billions on the research and development of new drugs, but thats nothing compared with the profits they get in return for selling the,. It also helps that the US government grants drug companies long patents that prevent the availability of cheaper, generic versions. Pfizer, Bristol-Myers Squibb, and Schering-Plough produce and sell some of the best selling drugs in ...
Pharmaceutical companies spend billions on the research and development of new drugs, but thats nothing compared with the profits they get in return for selling the,. It also helps that the US government grants drug companies long patents that prevent the availability of cheaper, generic versions. Pfizer, Bristol-Myers Squibb, and Schering-Plough produce and sell some of the best selling drugs in ...
NASA Budget
NASA divides up its budget to CALIPSO or we called it cloud-aerosol lidar and infrared pathfinder satellite observation, Fast (Fast Auroral Snapshots explorer) Image (Imager for magnetopause to Aurora global Exploration) Messenger (Mercury Surface), Space Environment, Geochemistry and ranging, Messenger (Mercury Surface, Space Environment, Geochemistry, and ranging), Trace (Transition Region and C...
NASA divides up its budget to CALIPSO or we called it cloud-aerosol lidar and infrared pathfinder satellite observation, Fast (Fast Auroral Snapshots explorer) Image (Imager for magnetopause to Aurora global Exploration) Messenger (Mercury Surface), Space Environment, Geochemistry and ranging, Messenger (Mercury Surface, Space Environment, Geochemistry, and ranging), Trace (Transition Region and C...
Recalled Baby Products Listed
Last April 2009, Toys R Us has stopped ordering drop-side cribs because of safety concerns.The company's chairman and chief executive told the wall street Journal. Dropside models figured in many of the recalls in which missing or loose hardware caused the drop-side to separate form the crib, creating a gap in which a baby can become trapped or strangle.There are two different types of recalls, th...
Last April 2009, Toys R Us has stopped ordering drop-side cribs because of safety concerns.The company's chairman and chief executive told the wall street Journal. Dropside models figured in many of the recalls in which missing or loose hardware caused the drop-side to separate form the crib, creating a gap in which a baby can become trapped or strangle.There are two different types of recalls, th...
How Much Weddings Really Cost
Each year there are newly weds. But how much do they usually spent in their wedding?Average cost of engagement ring is $3,186 and there are 2,152,000 weddings in us last 2009, so thats 5,896 per day. In online wedding economy. there are $6.7 billion online while in tradition there are $42.2 billion. Most in each wedding, people would spend a lot of dollars for Attire and accesories, beau...
Each year there are newly weds. But how much do they usually spent in their wedding?Average cost of engagement ring is $3,186 and there are 2,152,000 weddings in us last 2009, so thats 5,896 per day. In online wedding economy. there are $6.7 billion online while in tradition there are $42.2 billion. Most in each wedding, people would spend a lot of dollars for Attire and accesories, beau...
Cost of 4th of July
What is the Black Friday Experience?
US vs UK on Self-Employment
US self employed earn #13,720 compared to UK. This amount is already enough to buy 3843 big macs.US average self employed wage is $45,092 while on UK average wage in self employed is $31,372.Self employed workers in UK have to work for 146 hous. That is more than a us worker to earn the same as the average salaried employee.
US self employed earn #13,720 compared to UK. This amount is already enough to buy 3843 big macs.US average self employed wage is $45,092 while on UK average wage in self employed is $31,372.Self employed workers in UK have to work for 146 hous. That is more than a us worker to earn the same as the average salaried employee.
 Upload your infographic here and contribute to our community.
Leave a Reply