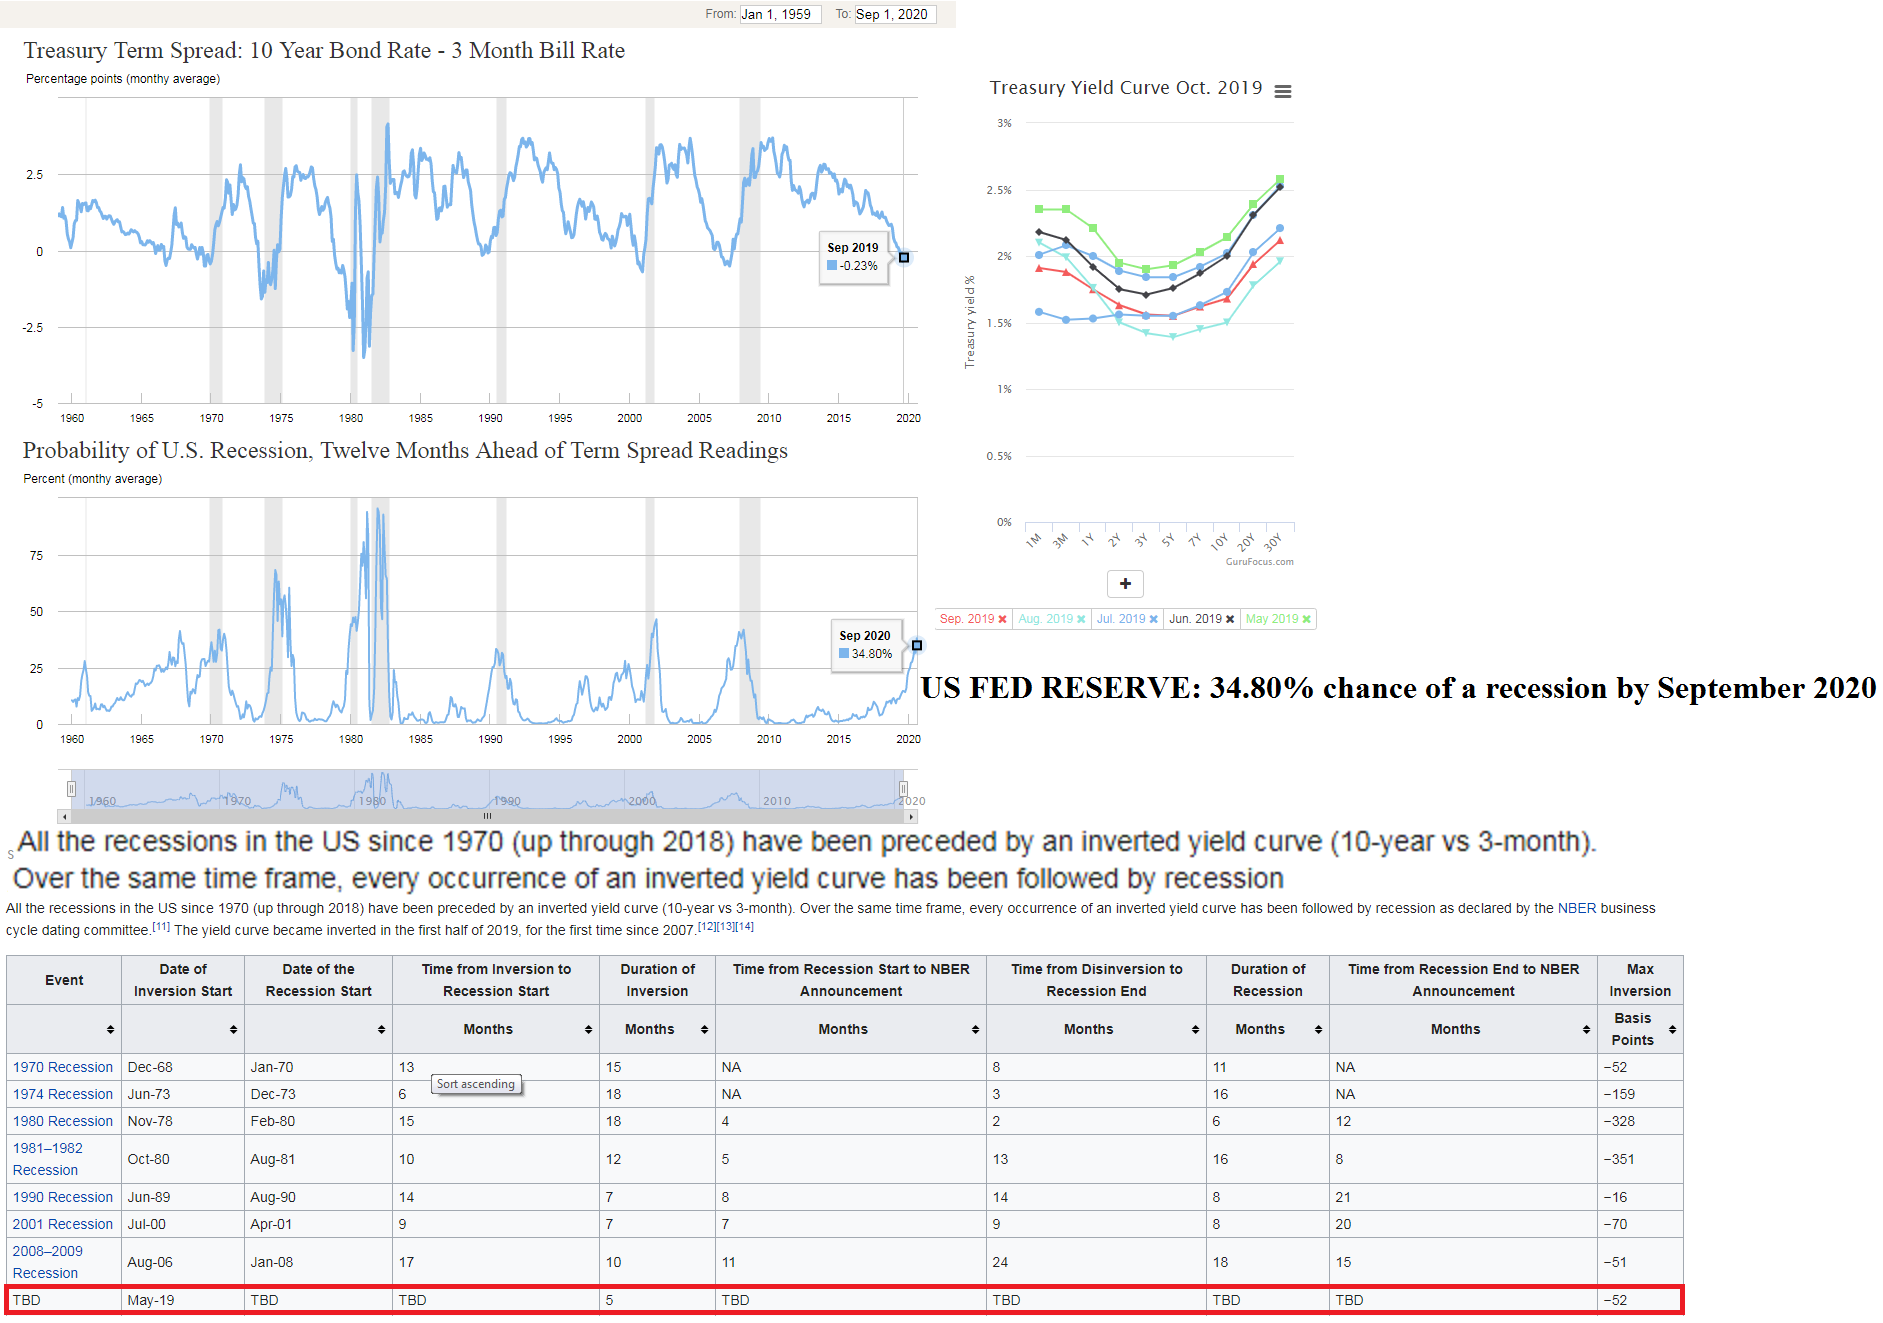
Talks of a recession in the United States economy has been discussed by many over the years as this cycle has been the longest bull market in history without having a recession. The economy has been booming since the last economic recession during 2009.
The below graphic will show the reader that the economy has always fell into recession when the 3 month treasury rate yields more than the 10 year treasury rate. This is displayed historically with recessions shaded in gray.
The federal reserve now has a recession probability of 35% happening by September 2020.
Related posts:
BBC Budget
CG: Economics, Evironment, Infastructure, Politics, and Society
Credit Card Profit
US Renters Insurance
Part one is the most expensive places in the US to rent. Source: Census.gov. California has only the average rent of $1, 135, Connecticut has only the average rent of $970, Florida with $947, Haiwaii with $1,362, Massachesets is $947 and maryland average rent is $1,074
Part one is the most expensive places in the US to rent. Source: Census.gov. California has only the average rent of $1, 135, Connecticut has only the average rent of $970, Florida with $947, Haiwaii with $1,362, Massachesets is $947 and maryland average rent is $1,074
Global Credit Ratings
History of eCommerce
How to Start Cutting Costs
Lending to the Poor
The lending of payday loans or paycheck advance loans has been deemed to be loan sharing in 13 states.So if you have ever been in the previous situation, your credit rating is probably pretty bad. Not all credit cards are created equal. When seeking the convenience of plastic, know what you are signing up for.Some stuff isnt cheap, and it can be hard to pay upfront for high cost ietm if credit is ...
The lending of payday loans or paycheck advance loans has been deemed to be loan sharing in 13 states.So if you have ever been in the previous situation, your credit rating is probably pretty bad. Not all credit cards are created equal. When seeking the convenience of plastic, know what you are signing up for.Some stuff isnt cheap, and it can be hard to pay upfront for high cost ietm if credit is ...
Automotive Family Tree
Early Stage Business Model
Timing the Market Doesn't Work
Many investors try to time the market for the highest return. Timing the market does not work, as shown in the infographic below. It would also be equally as disadvantageous to try and time a recession for maximum return. For an investor that invest in the S&P 500 in 1995, the average annual return yielded $65,000 for each $10,000 invested if the inverstor held until 2015. The informat...
Many investors try to time the market for the highest return. Timing the market does not work, as shown in the infographic below. It would also be equally as disadvantageous to try and time a recession for maximum return. For an investor that invest in the S&P 500 in 1995, the average annual return yielded $65,000 for each $10,000 invested if the inverstor held until 2015. The informat...
Crisis Management for Airlines
Anatomy of a Librarian
How Fair Trade Works
Heath Care by Nation
Modern Media Agency
Workplace Wishlist
Green offices and greater mobility are same of the preferences of young employees.
Green offices and greater mobility are same of the preferences of young employees.
Women in the Boardroom
Women in the boardroom explains that in 2009 women still hold less than a quarter of senior management positions in privately help businesses globally.
Women in the boardroom explains that in 2009 women still hold less than a quarter of senior management positions in privately help businesses globally.
 Upload your infographic here and contribute to our community.
Leave a Reply