
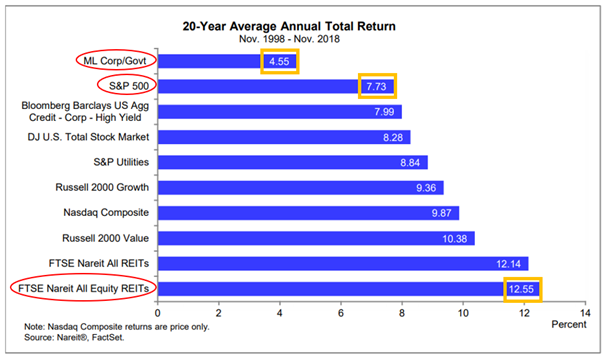
Not all markets are created equal. At least, according to this newest infographic. According to FactSet, over a 20 year average annual total return, which would include capital gains and dividends, REITs or Real Estate Investment Trusts have returned more than the S&P 500.
And this gain over the S&P 500 is pretty significant: 4.82% higher gain than the S&P 500. Even more interesting, the S&P Utilities index also yielded more than the S&P 500 by over 1%! That seems to be counter intuitive that a lower risk based asset yields more than an index, but in a lower interest rate environment, REITs, Utilities, and higher dividend players can have an advantage. With lower interest rates, companies can invest in longer term fixed assets and gain a better spread, as the rate these earning assets help produce is not affected as much.
So next time you think a utility company or a REIT is boring, check out the graph below!
Related posts:
For the Top 260 more than 7000 jobs and then focused on jobs that the bereau of labors statistics projects will grow 10% more over the next decade and that required at least bachelors degree. Titles with median pay below $65,000 for experienced workers and fewer than 10,000 positions nationwide were screened out.For top 100 eliminated jobs that did poorly during the recession and grouped jobs with...
Each year there are newly weds. But how much do they usually spent in their wedding?Average cost of engagement ring is $3,186 and there are 2,152,000 weddings in us last 2009, so thats 5,896 per day. In online wedding economy. there are $6.7 billion online while in tradition there are $42.2 billion. Most in each wedding, people would spend a lot of dollars for Attire and accesories, beau...
Solar savings is surely effective. With Solar technology, you can have extra space storage plus you can also saves energy and saves money. Just take the storage properties, secure and convenient self-storage optoins with 34 states facilities and 2nd largest US self storage company that serves 34 years with their customers.
Green offices and greater mobility are same of the preferences of young employees.
"Life gets better" is what many younger to Middle Ages adults tell others that are younger than them. This graph would say otherwise! According to research done that questioned various people about how happy they were by age, life seems to get worse, then better. People repeatedly said they were more and more depressed from 20-40 years old. It appears most people felt very dissatisfied with their ...
Barrack Obama is the first major candidate to decline participation in the public financing system for presdential campaigns, He's found a more effective way to raise money by leveraging the power of the american people through online social networks.Social networking is a virtual community where members share and communicate online. News and information is often deemed more trustworthy beca...
DGP is a standard meaure of a countrys overall economic output. Its the market value of all final goods and services made within the borders of a country within a year.Inflation is the rise in the general level of prices of goos and services in an economy over a period of time. When a developing economy starts growing fast, often richer countries accuse it of cheating by keeping its wages and...
 Upload your infographic here and contribute to our community.
Leave a Reply