
The S&P 500 index is a stock market index which tracks the top 500 public companies by market cap. This is generally considered a good indicator of the health of the United States economy since other indexes such as the DOW and Nasdaq have either too few equities in the index or are weighted too heavily toward technology respectively.
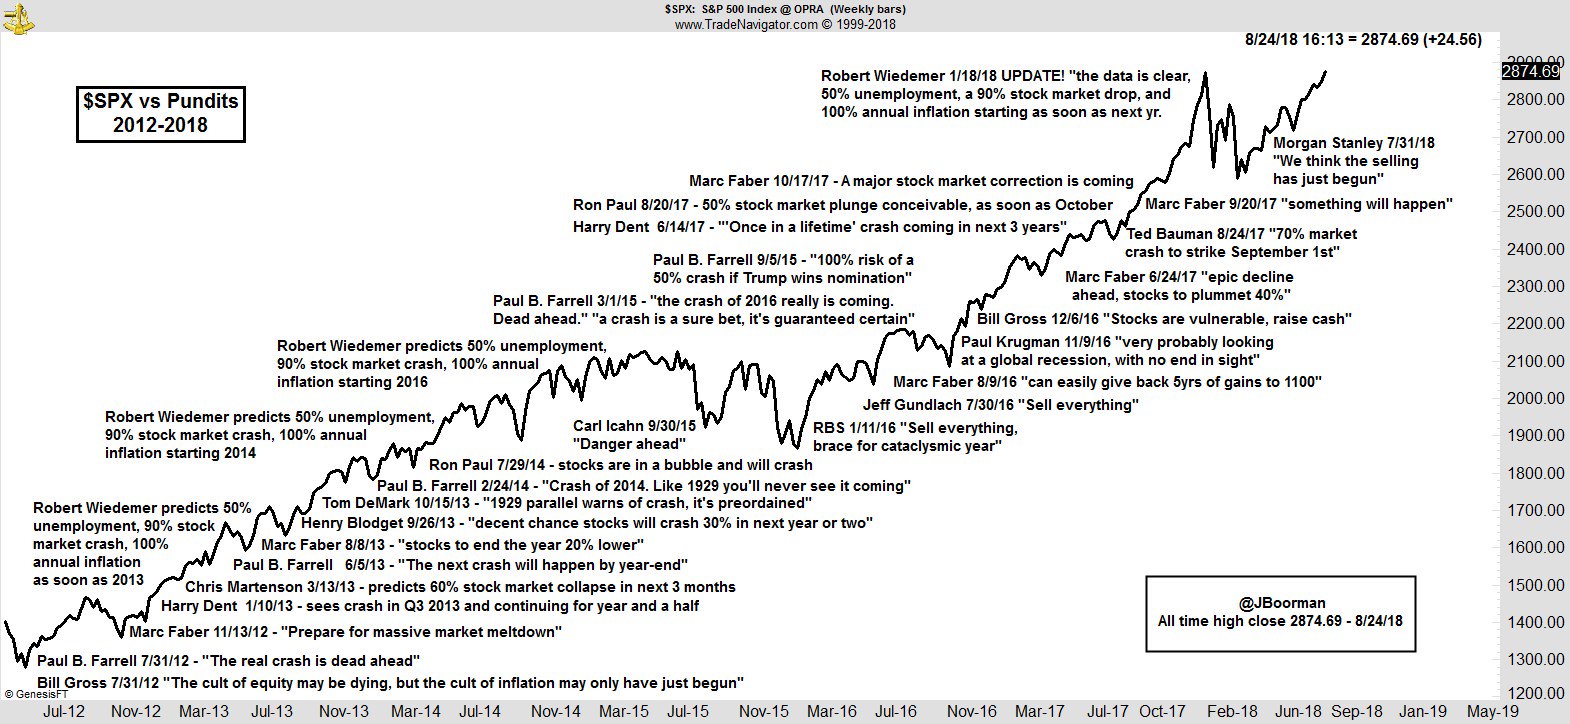
The below infographic shows each time a news contributor mocked the bull market economy and swore the stock market would crash along with everything else. You can see below that each one of those predictions were wrong and still in 2019 we have a raging bull market.
You can see that today is no different: all the talking heads on television and on the internet are still saying the economy will crash. The doom and gloomers will be right eventually, but the market is generally in a bull market more often than a bear market going back until inception of the stock market.
Related posts:
This avant-garde Range Rover has capability at its core. It leads the way in progressive design from the renowned Range Rover floating roof to the refined interior with Suedecloth or Windsor leather options. Read more about the features of this avant-garde Range Rover below.
The lending of payday loans or paycheck advance loans has been deemed to be loan sharing in 13 states.So if you have ever been in the previous situation, your credit rating is probably pretty bad. Not all credit cards are created equal. When seeking the convenience of plastic, know what you are signing up for.Some stuff isnt cheap, and it can be hard to pay upfront for high cost ietm if credit is ...
Banking on the world bank shows that each countries around the world are depending on its assistance to help them support their often fragile economies.
 Upload your infographic here and contribute to our community.
Leave a Reply