Bitcoin is a global payment system which uses blockchain technology to verify transactions. Every user on the chain agrees that each transaction occurred through consensus. Some individuals run “miners” which use electricity and “work” in order to prove a transaction happened. Since miners need real world resources to run the miners, the chain has a real cost in order to attack, making the network secure.
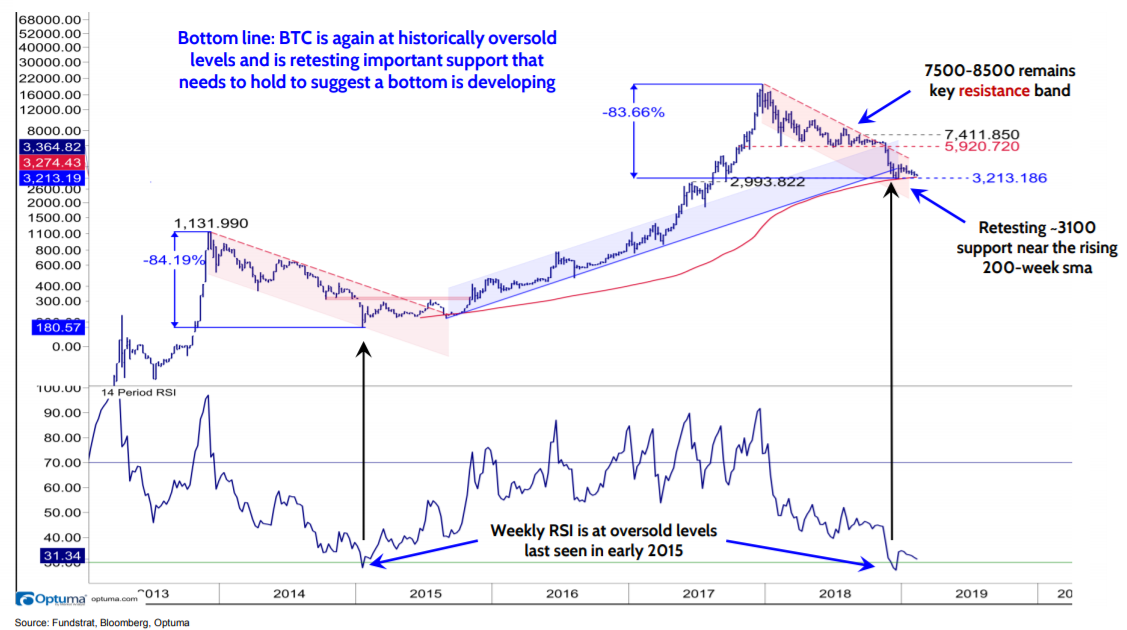
Below is a chart that was downloaded on 2/8/2019, which looking back in the past, was near BTC’s historical bottom for this market cycle between 2018-2019. It shows that retesting the $3,100 support near the rising 200 week simple moving average would be a key support. It also shows that the weekly relative strength index was at the same position it was in 2015, indicating a bottom. It was at 31.34.
This chart actually proved to be right, to many critics’ dismay. This chart shows that if we apply the same bottom finding techniques in markets, we may have actually found a fool proof way to find the bottom in a market cycle.
 Upload your infographic here and contribute to our community.
We still don’t know if it actually was a bottom until a new all time high is reached!