
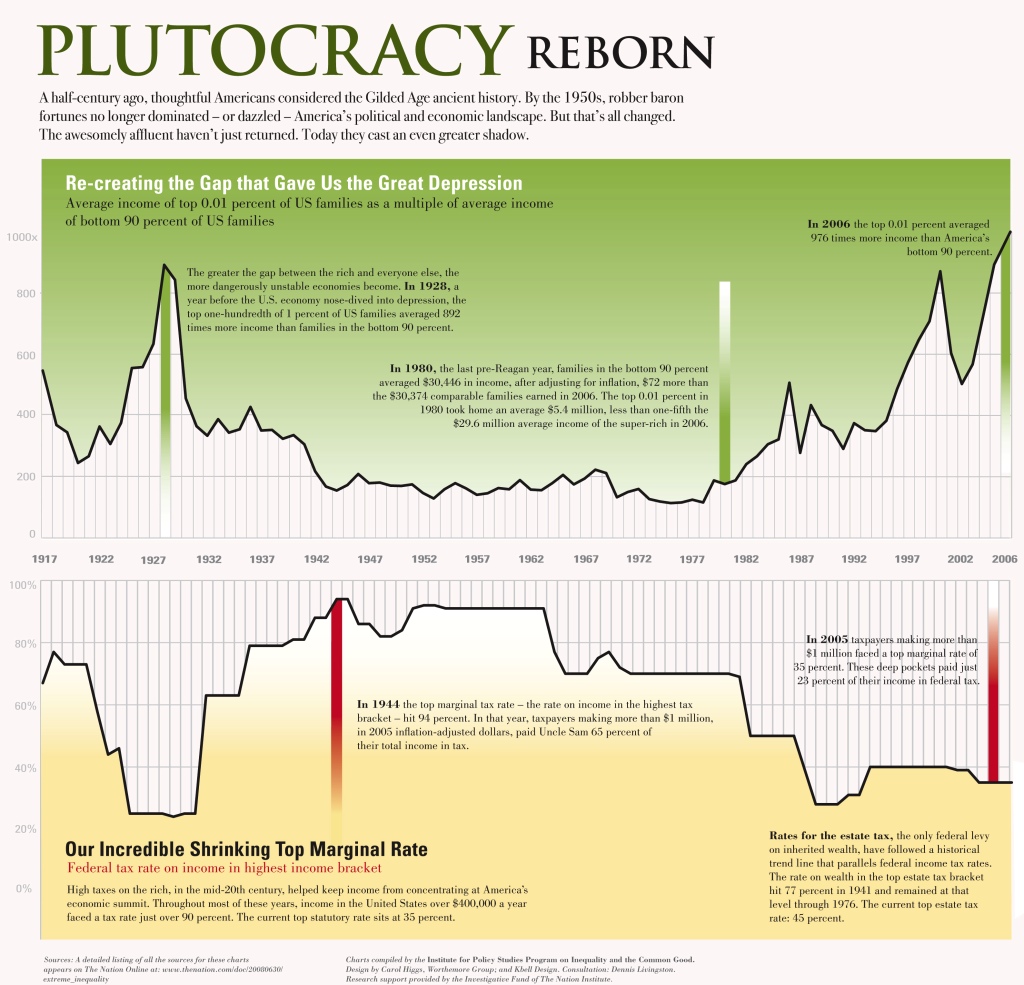
A half-century ago thoughful americans considered the Gilded Age ancient history. By the 1950’s, robber baron fortunes no longer dominated or dazzled. America’s political and economic landscape. But thats all changed. The awesomely affluent havent just retuned. Today they cast an even greater shadow.
High taxes on the rich, in the mid-20th century helped keep income from concentrating at America’s economic summit. Throughout most of these years, income in the United States over $400,000 a year faced a tax rate over 90 percent. The current top rate sits at 35 percent.
Plutocracy Reborn
Related posts:
India vs US Economy
In this infograhpic, one can see how the United States stacks up against India currently. The GDP of India is small in comparision to the United States, but its growth rate is substantially higher. Check out what other stats India is better in below.
In this infograhpic, one can see how the United States stacks up against India currently. The GDP of India is small in comparision to the United States, but its growth rate is substantially higher. Check out what other stats India is better in below.
Life Satisfaction and Happiness by Age
"Life gets better" is what many younger to Middle Ages adults tell others that are younger than them. This graph would say otherwise! According to research done that questioned various people about how happy they were by age, life seems to get worse, then better. People repeatedly said they were more and more depressed from 20-40 years old. It appears most people felt very dissatisfied with their ...
"Life gets better" is what many younger to Middle Ages adults tell others that are younger than them. This graph would say otherwise! According to research done that questioned various people about how happy they were by age, life seems to get worse, then better. People repeatedly said they were more and more depressed from 20-40 years old. It appears most people felt very dissatisfied with their ...
Fortune 100 Countries
REITs and Utility Companies Yield More than S&P 500
Not all markets are created equal. At least, according to this newest infographic. According to FactSet, over a 20 year average annual total return, which would include capital gains and dividends, REITs or Real Estate Investment Trusts have returned more than the S&P 500. And this gain over the S&P 500 is pretty significant: 4.82% higher gain than the S&P 500. Even more inte...
Not all markets are created equal. At least, according to this newest infographic. According to FactSet, over a 20 year average annual total return, which would include capital gains and dividends, REITs or Real Estate Investment Trusts have returned more than the S&P 500. And this gain over the S&P 500 is pretty significant: 4.82% higher gain than the S&P 500. Even more inte...
What is CEO Compensation?
Where Cell Phones Go When They Die
Credit Card Fees
2010 Year of Optimism
Where Jobs are in the USA
Atonomy of Market Researchers
What Happens in a Recession
What is a Computer Tree?
Cost of Fitness at Home
Credit Debt Levels
Biblical Unit Measurements
Global Credit Ratings
Infographic of the Mortgage Crisis
60 Second Guide to Debt Relief
 Upload your infographic here and contribute to our community.
Leave a Reply